Most Recent CompTIA DA0-001 Exam Questions & Answers
Prepare for the CompTIA Data+ Certification Exam exam with our extensive collection of questions and answers. These practice Q&A are updated according to the latest syllabus, providing you with the tools needed to review and test your knowledge.
QA4Exam focus on the latest syllabus and exam objectives, our practice Q&A are designed to help you identify key topics and solidify your understanding. By focusing on the core curriculum, These Questions & Answers helps you cover all the essential topics, ensuring you're well-prepared for every section of the exam. Each question comes with a detailed explanation, offering valuable insights and helping you to learn from your mistakes. Whether you're looking to assess your progress or dive deeper into complex topics, our updated Q&A will provide the support you need to confidently approach the CompTIA DA0-001 exam and achieve success.
The questions for DA0-001 were last updated on Jan 19, 2025.
- Viewing page 1 out of 63 pages.
- Viewing questions 1-5 out of 314 questions
An analyst is building a new dashboard for a user. After an initial conversation with the user. the analyst created a mock-up of the dashboard. Which of the following best explains why the analyst created the mock-up?
Answer C) To confirm important details before dashboard development begins.
Which one of the following would not normally be considered a summary statistic?
Explanation
Simply put, a z-score (also called a standard score) gives you an idea of how far from the mean a data point is. But more technically it's a measure of how many standard deviations below or above the population mean a raw score is. A z-score can be placed on a normal distribution curve.
Refer to the exhibit.
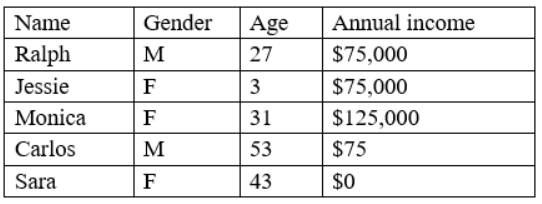
Given the following data:

Which of the following BEST describes the data set?
This is because inconsistency is a type of data quality issue that occurs when the data does not follow a common format, structure, or rule across different sources or systems, which can affect the efficiency and performance of the analysis or process. Inconsistency can be caused by having different spellings, punctuations, capitalizations, or abbreviations for the same or similar values in a data set, such as ''M'', ''m'', ''Male'', or ''male'' for gender in this case. Inconsistency can be eliminated or reduced by using data cleansing techniques, such as standardizing or normalizing the data values. The other options are not correct descriptions of the data set. Here is why:
Data bias is a type of data quality issue that occurs when the data is not representative or proportional of the population or the parameter, which can affect the validity and reliability of the analysis or process. Data bias can be caused by having a sample that is too small, too large, or too skewed for the population or the parameter, such as having only male customers for a product that targets both genders in this case. Data bias can be eliminated or reduced by using sampling techniques, such as stratified or cluster sampling.
The data is incomplete is a type of data quality issue that occurs when the data is absent or missing in a data set, which can affect the accuracy and reliability of the analysis or process. The data is incomplete can be caused by various factors, such as human error, system error, or non-response. The data is incomplete can be addressed by using various methods, such as replacing or imputing the missing values with some reasonable estimates, such as mean, median, mode, or regression.
The data is outliers is a type of data quality issue that occurs when the data has values that are unusually high or low compared to the rest of the data set, which can affect the quality and validity of the analysis or process. The data is outliers can be caused by various factors, such as measurement error, natural variation, or extreme events. The data is outliers can be addressed by using various methods, such as removing or filtering out the outliers, or using robust statistics that are less sensitive to outliers, such as median, interquartile range, or box plot.
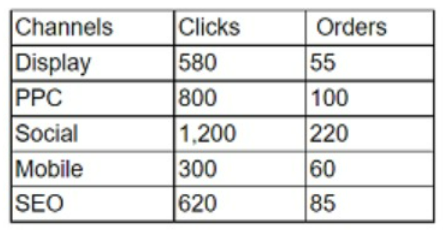
A data analyst received the information in the table below from a recently completed marketing campaign:

Which of the following is the total order conversion rate?
The correct answer is A. 13.2%.
The total order conversion rate is the ratio of the total number of orders to the total number of clicks, expressed as a percentage. To calculate the total order conversion rate, we need to sum up the clicks and orders from all the channels, and then divide the orders by the clicks and multiply by 100.
Using the data from the table, we can do the following:
Total clicks = 580 + 800 + 1,200 + 300 + 620 = 3,500
Total orders = 55 + 100 + 220 + 60 + 85 = 520
Total order conversion rate = (520 / 3,500) x 100 = 14.857%
Rounding to one decimal place, we get 14.9%
Therefore, the total order conversion rate is 14.9%.
Unlock All Questions for CompTIA DA0-001 Exam
Full Exam Access, Actual Exam Questions, Validated Answers, Anytime Anywhere, No Download Limits, No Practice Limits
Get All 314 Questions & Answers