Most Recent Qlik QSDA2024 Exam Questions & Answers
Prepare for the Qlik Sense Data Architect Certification Exam - 2024 exam with our extensive collection of questions and answers. These practice Q&A are updated according to the latest syllabus, providing you with the tools needed to review and test your knowledge.
QA4Exam focus on the latest syllabus and exam objectives, our practice Q&A are designed to help you identify key topics and solidify your understanding. By focusing on the core curriculum, These Questions & Answers helps you cover all the essential topics, ensuring you're well-prepared for every section of the exam. Each question comes with a detailed explanation, offering valuable insights and helping you to learn from your mistakes. Whether you're looking to assess your progress or dive deeper into complex topics, our updated Q&A will provide the support you need to confidently approach the Qlik QSDA2024 exam and achieve success.
The questions for QSDA2024 were last updated on Jan 17, 2025.
- Viewing page 1 out of 10 pages.
- Viewing questions 1-5 out of 50 questions
Refer to the exhibit.

Refer to the exhibit.
A data architect needs to create a data model for a new app. Users must be able to see:
* Total sales for each customer
* Total sales for a given state
* Customers that have not had any sales
* Names of salesperson and regional account managers
* Total number of sales by date
Which steps should the data architect perform to meet these requirements?
Which steps should the data architect perform to meet these requirements?
In the provided scenario, the data architect needs to create a data model that supports various analyses, including total sales for each customer, total sales by state, identifying customers with no sales, and displaying the names of salespersons and regional account managers.
Here's why Option C is the correct choice:
Loading the Sales Table: The Sales table contains key information related to sales transactions, including SaleID, CustomerID, Amount, SaleDate, SalesPersonID, and RegionalAcctMgrID. This table must be loaded first as it will be central to the analysis.
Loading the Customers Table: The Customers table includes customer details such as CustID, CustName, Address, City, State, and Zip. Loading this table and linking it to the Sales table via the CustomerID field allows you to perform analyses such as total sales per customer and total sales by state. Importantly, loading the customers separately will also allow the identification of customers without any sales.
Loading the Employees Table Twice: The Employees table must be loaded twice because it is used to look up two different roles in the sales process: the SalesPersonID and the RegionalAcctMgrID. When loading the table twice:
The first instance of the Employees table will be used to map the SalesPersonID to EmployeeName.
The second instance will be used to map the RegionalAcctMgrID to EmployeeName.
Aliasing the EmployeeID field appropriately in each instance is crucial to prevent creating synthetic keys and to ensure the correct association with the roles in the sales process.
This approach ensures that the data model will correctly support all the required analyses, including identifying customers without sales, which is crucial for meeting the business requirements.
Option A and Option B propose using a mapping load and ApplyMap, which can complicate the model and does not directly address all the business requirements.
Option D involves aliasing fields in a way that could create unnecessary complexity and might not accurately reflect the relationships in the data.
Thus, Option C is the correct answer as it best meets the requirements while maintaining a clear and functional data model.
A data architect needs to acquire social media data for the past 10 years. The data architect needs to track all changes made to the source data, include all relevant fields, and reload the application four times a day.
What information does the data architect need?
The scenario describes a need to track social media data over the past 10 years, capturing all changes (inserts, updates, deletes) while reloading the data four times a day.
To manage this:
ModificationTime: This field is essential for tracking changes over time. It indicates when a record was last modified, allowing the script to determine whether it needs to insert, update, or delete records.
Primary Key Field: A primary key is crucial for uniquely identifying records. It enables the script to match records in the source with those already loaded, facilitating updates and deletions.
Insert and Update Records: The script should handle both inserting new records and updating existing ones based on the ModificationTime.
Remove Records: If records are deleted in the source, they should also be removed in the Qlik Sense data model to maintain consistency.
This approach ensures that all changes in the social media data are accurately captured and reflected in the Qlik Sense application.
A data architect receives an error while running script.
What will happen to the existing data model?
In Qlik Sense, when a data load script is executed and an error occurs, the script execution is halted immediately, and any tables that were being loaded at the time of the error are discarded. However, the existing data model---i.e., the last successfully loaded data model---remains intact and is not affected by the failed script. This ensures that the application retains the last known good state of the data, avoiding any partial or inconsistent data loads that could occur due to an error.
When the script encounters an error:
The tables that were successfully loaded prior to the error are retained in the session, but these tables are not merged with the existing data model.
The existing data model before the script was executed remains unchanged and is maintained.
No partial or incomplete data is loaded into the application; hence, the data model remains consistent and reliable.
Qlik Sense Data Architect Reference This behavior is designed to protect the integrity of the data model. In scenarios where script execution fails, the user can debug and fix the script without risking the data integrity of the existing application. The key references include:
Qlik Help Documentation: Provides detailed information on how Qlik Sense handles script errors, highlighting that the existing data model remains unchanged after an error.
Data Load Editor Practices: Best practices dictate ensuring that the script is fully functional before executing it to avoid data inconsistency. In cases where an error occurs, understanding that the current data model is maintained helps in strategic debugging and script correction.
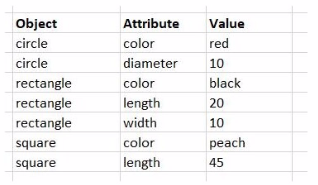
Exhibit.

While performing a data load from the source shown, the data architect notices it is NOT appropriate for the required analysis.
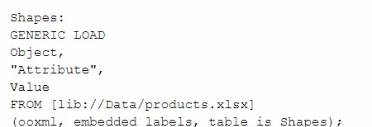
The data architect runs the following script to resolve this issue:

How many tables will this script create?
In this scenario, the data architect is using a GENERIC LOAD statement in the script to handle the data structure provided. A GENERIC LOAD is used in Qlik Sense when you have data in a key-value pair structure and you want to transform it into a more traditional table structure, where each attribute becomes a column.
Given the input data table with three columns (Object, Attribute, Value), and the attributes in the Attribute field being either color, diameter, length, or width, the GENERIC LOAD will create separate tables based on the combinations of Object and each Attribute.
Here's how the GENERIC LOAD works:
For each unique object (circle, rectangle, square), the GENERIC LOAD creates separate tables based on the distinct values of the Attribute field.
Each of these tables will contain two fields: Object and the specific attribute (e.g., color, diameter, length, width).
Breakdown:
Table for circle:
Fields: Object, color, diameter
Table for rectangle:
Fields: Object, color, length, width
Table for square:
Fields: Object, color, length
Each distinct attribute (color, diameter, length, width) and object combination generates a separate table.
Final Count of Tables:
The script will create 6 separate tables: one for each unique combination of Object and Attribute.
Qlik Sense Documentation on Generic Load: Generic loads are used to pivot key-value pair data structures into multiple tables, where each key (in this case, the Attribute field values) forms a new column in its own table.
Refer to the exhibit
A large transport company (Company A) acquires a smaller rival (Company B).
Company A has been using Qlik Sense tor 6 years to track revenue per ship journey. Ship journeys with no revenue (such as journeys to shipyards for repair) always show revenue of $0.
Company A wants to combine its data set with the data set of the acquired Company B. Company B's ship journey data shows $0 revenue in one of the following ways:
* A NULL value
* A value with one or more blank spaces (ASCII char code 32)
The data architect wants to conform the Company B data to the Company A standard, specifically regarding the use of an explicit $0 for journeys without revenue. Which script line should the data architect use?
A)

B)

C)

D)

In this scenario, the data architect needs to conform the revenue data from Company B to match the data standard of Company A, where $0 is explicitly used to represent journeys without revenue.
Explanation of the Correct Script:
Option A: money(replace(Revenue, chr(32), 0)) AS [Revenue Conformed]
replace(Revenue, chr(32), 0): This part of the expression replaces any spaces (ASCII character code 32) in the Revenue field with 0.
money(...): This function formats the resulting value as currency. Since Company B may have either null values or spaces where 0 should be, this script ensures that any blanks are replaced with 0 and then formatted as currency.
Why Option A is Correct:
Handling Spaces: The replace() function is effective in replacing spaces with 0, conforming to Company A's standard of using $0 for non-revenue journeys.
Handling NULL Values: The money() function is used to ensure the final output is formatted as currency. However, it's important to note that NULL values are not directly handled by the replace() function, which is why it is applied before money() to deal with spaces.
Unlock All Questions for Qlik QSDA2024 Exam
Full Exam Access, Actual Exam Questions, Validated Answers, Anytime Anywhere, No Download Limits, No Practice Limits
Get All 50 Questions & Answers