Trusted Worldwide Questions & Answers
Most Recent Qlik QV12BA Exam Questions & Answers
Prepare for the QlikView 12 Business Analyst Certification Exam exam with our extensive collection of questions and answers. These practice Q&A are updated according to the latest syllabus, providing you with the tools needed to review and test your knowledge.
QA4Exam focus on the latest syllabus and exam objectives, our practice Q&A are designed to help you identify key topics and solidify your understanding. By focusing on the core curriculum, These Questions & Answers helps you cover all the essential topics, ensuring you're well-prepared for every section of the exam. Each question comes with a detailed explanation, offering valuable insights and helping you to learn from your mistakes. Whether you're looking to assess your progress or dive deeper into complex topics, our updated Q&A will provide the support you need to confidently approach the Qlik QV12BA exam and achieve success.
The questions for QV12BA were last updated on Jan 17, 2025.
- Viewing page 1 out of 10 pages.
- Viewing questions 1-5 out of 50 questions
A business analyst has data for these fields
* Year
* Sales Amount
* Product Number
* Country
* Order Number
Which three KPIs may be calculated? (Select three.)
A business analyst designs a sheet with a list of customers. The analyst wants to add a small image to show the company logo for each customer.
Which three objects meet this requirement? (Select three )
A customer needs to measure sales by assigned sales representative
All previous and current sales representative assignments must be included so that sales representatives receive credit for sales activities on both previous and current sales.
Which type of dimension is described by the sales representative assigned to the client?
Refer to the exhibit.
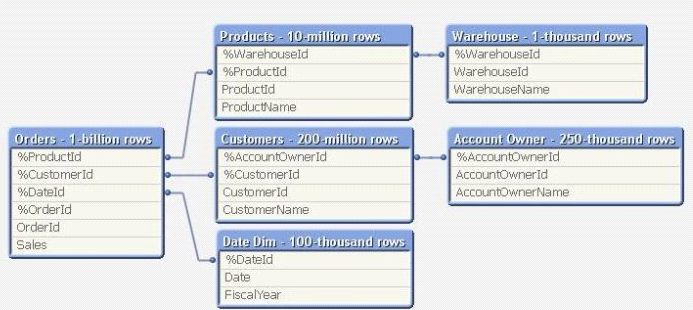
Which is the highest performing expression to accurately count the number of Account Owners?
Refer to the exhibit.

The Sales table shown represents the entire data set A business analyst adds an expression in a document:

Next, the analyst selects Year = '2010' and RegionID = '2\. What is the result of the expression with these selections?
Unlock All Questions for Qlik QV12BA Exam
Full Exam Access, Actual Exam Questions, Validated Answers, Anytime Anywhere, No Download Limits, No Practice Limits
Get All 50 Questions & Answers