Trusted Worldwide Questions & Answers
Most Recent Salesforce Marketing-Cloud-Intelligence Exam Dumps
Prepare for the Salesforce Marketing Cloud Intelligence Accredited Professional exam with our extensive collection of questions and answers. These practice Q&A are updated according to the latest syllabus, providing you with the tools needed to review and test your knowledge.
QA4Exam focus on the latest syllabus and exam objectives, our practice Q&A are designed to help you identify key topics and solidify your understanding. By focusing on the core curriculum, These Questions & Answers helps you cover all the essential topics, ensuring you're well-prepared for every section of the exam. Each question comes with a detailed explanation, offering valuable insights and helping you to learn from your mistakes. Whether you're looking to assess your progress or dive deeper into complex topics, our updated Q&A will provide the support you need to confidently approach the Salesforce Marketing-Cloud-Intelligence exam and achieve success.
The questions for Marketing-Cloud-Intelligence were last updated on Mar 29, 2025.
- Viewing page 1 out of 13 pages.
- Viewing questions 1-5 out of 63 questions
What is the relationship between ''Media Buy Key'' and ''Campaign Key''?
Typically, 'Campaign Key' is a unique identifier for a specific marketing campaign, while 'Media Buy Key' refers to the purchases of advertising space associated with that campaign. A campaign can have multiple media buys, so the relationship is many-to-one, with many media buys (Media Buy Keys) associated with a single campaign (Campaign Key).
Which Marketing Cloud Intelligence field is considered an attribute and not a ''variable''?
In Marketing Cloud Intelligence, attributes refer to characteristics of the data that describe the environment or context but do not change within the scope of the data being analyzed. 'Device Category' is typically an attribute as it describes a characteristic of the device used and doesn't vary within a given session or user interaction. In contrast, variables are typically metrics or dimensions that can change value or be measured.
A technical architect is provided with the logic and Opportunity file shown below:
The opportunity status logic is as follows:
For the opportunity stages ''Interest'', ''Confirmed Interest'' and ''Registered'', the status should be ''Open''.
For the opportunity stage ''Closed'', the opportunity status should be closed.
Otherwise, return null for the opportunity status.
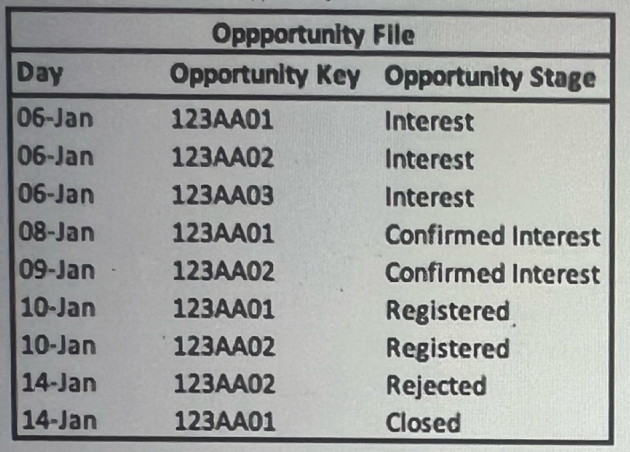
Given the above file and logic and assuming that the file is mapped in a GENERIC data stream type with the following mapping:
''Day'' --- Standard ''Day'' field
''Opportunity Key'' > Main Generic Entity Key
''Opportunity Stage'' --- Generic Entity key 2
A pivot table was created to present the count of opportunities in each stage. The pivot table is filtered on Jan 7th -11th.Which option reflects the stage(s) the opportunity key 123AA01 is associated with?
Filtering the pivot table on January 7th-11th, we see that the Opportunity Key 123AA01 appears on January 6th with the stage 'Interest' and then on January 10th with the stage 'Registered'. Even though the 'Interest' stage is not within the filtered dates, it is the initial stage of the opportunity, so it should be counted along with the 'Registered' stage which falls within the filter range.
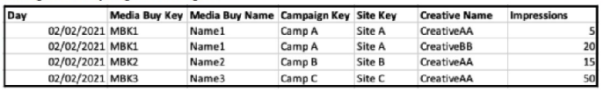
A client would like to integrate the following two sources:
Google Campaign Manager:
IAS:
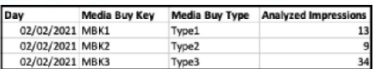
After configuring a Parent-Child relationship between the files, which query should an implementation engineer run in order to QA the setup?
To QA the Parent-Child relationship setup between Google Campaign Manager and IAS data sources, it is essential to query fields that are common to both sources and that are relevant to the relationship. 'Media Buy Type' and 'Media Buy Name' are common identifiers between the two datasets. 'Impressions' from the Google Campaign Manager and 'Analyzed Impressions' from the IAS data are the metrics that should be compared to ensure they match or correlate as expected due to the Parent-Child relationship. The QA process involves checking that the data is correctly aligned and that the metrics from the parent source (Google Campaign Manager) are properly related to the metrics from the child source (IAS). Reference: Salesforce Marketing Cloud Intelligence documentation on data integration, Parent-Child relationships, and QA procedures for data setup.
A client's data consists of three data streams as follows:
Data Stream A:

The data streams should be linked together through a parent-child relationship.
Out of the three data streams, Data Stream C is considered the source of truth for both the dimensions and measurements.
The client would like to have a "Site Revenue" measurement.
This measurement should return the highest revenue value per Site, for example:
For Site Key 'SK_C_2', the "Site Revenue" should be $7.00.
When aggregated by date, the "Site Revenue" measurement should return the total sum of the results of all sites.
For example:
For the date 1 Apr 2020, "Site Revenue" should be $11.00 (sum of Site Revenue for Site Keys 'SK_C_1' ($4.00) and 'SK_C_2' ($7.00))

Which options will yield the desired result;
Option #2: It suggests using the 'SUM' function to aggregate the 'Site Revenue' for each 'Site Key'. This is necessary to ensure that when aggregated by date, 'Site Revenue' should return the total sum of the highest revenue for all sites.
Option #4: It indicates changing the Aggregation Function of Revenue to 'MAX' within Data Stream C. This ensures that for a given 'Site Key', the highest revenue value is selected, which is correct for individual site revenue determination.
Combining Option #2 and Option #4 will provide the desired result:
For an individual 'Site Key', it will give the highest revenue (using MAX aggregation in Option #4).
When aggregating by date across all 'Site Key's, it will sum the highest revenues (using the SUM function in Option #2).
Unlock All Questions for Salesforce Marketing-Cloud-Intelligence Exam
Full Exam Access, Actual Exam Questions, Validated Answers, Anytime Anywhere, No Download Limits, No Practice Limits
Get All 63 Questions & Answers