Trusted Worldwide Questions & Answers
Most Recent Talend Data-Integration-Developer Exam Questions & Answers
Prepare for the Talend Data Integration Certified Developer Exam exam with our extensive collection of questions and answers. These practice Q&A are updated according to the latest syllabus, providing you with the tools needed to review and test your knowledge.
QA4Exam focus on the latest syllabus and exam objectives, our practice Q&A are designed to help you identify key topics and solidify your understanding. By focusing on the core curriculum, These Questions & Answers helps you cover all the essential topics, ensuring you're well-prepared for every section of the exam. Each question comes with a detailed explanation, offering valuable insights and helping you to learn from your mistakes. Whether you're looking to assess your progress or dive deeper into complex topics, our updated Q&A will provide the support you need to confidently approach the Talend Data-Integration-Developer exam and achieve success.
The questions for Data-Integration-Developer were last updated on Jan 20, 2025.
- Viewing page 1 out of 11 pages.
- Viewing questions 1-5 out of 55 questions
You are building a complex Job and want to explore different options for optimizing execution times using parallelism.
How can you identify execution times to verify the effectiveness of your changes?
Choose 2 answers
To identify execution times to verify the effectiveness of your changes, you can use one of these methods:
Reading the time stamps from the execution console in the Run view. This method allows you to see the start and end time of each subjob and component in your job, as well as the total execution time of the job. You can also see the number of rows processed by each component and the status of the job (success or failure).
Observing the execution times that annotate the flows in the Designer. This method allows you to see the execution time of each flow (main, lookup, reject, etc.) between components in your job. You can also see the number of rows processed by each flow and the throughput (rows per second) of each flow.
You cannot use these methods to identify execution times:
Observing the execution time in the Code view. This method does not show you the execution time of your job or its components, but only the generated code of your job in Java or Perl. The Code view is useful for debugging or customizing your code, but not for measuring performance.
A Job has two contexts defined: lest (the default) and Prod, and two context variables defined: path and server.
Which expression should you use to reference the path?
You have a tMap component whose main input provides the following data:
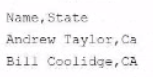
There is also a lookup table with the following data:
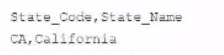
An inner join is configured between the State column of the main input with the State Code column of the lookup table.
What happens when the row containing the name Andrew laylor is processed?
You are building a Job to run outsode Talend Studio that must run on both Linux and Windows.
Which action should you take when building the Job?
To build a job to run outside Talend Studio that must run on both Linux and Windows, you need to select Build Job because jobs are runnable on all platforms. The Build Job option allows you to export your job as an executable file that can be run independently from Talend Studio on any platform that supports Java. You can access this option by right-clicking on your job in the Repository tree view and selecting Build Job. This will open a dialog box where you can configure the build settings, such as destination folder, archive name, context, etc.
You create a Job consisting of two subJobs, A and B. You added Joblet C with the intension of running it between A and B.
What are the minimum requirements to orchestrate this? (Choose Two)
To create a job consisting of two subjobs, A and B, and add a Joblet C with the intention of running it between A and B, you need to do the following steps:
Design subjob A by adding components and links to it in the Designer workspace.
Add a Start component to mark the beginning of subjob B and link it to subjob A using an OnSubjobOk trigger.
Design subjob B by adding components and links to it after the Start component in the Designer workspace.
Add a tJobletTriggerInput component to your Joblet C design and link it to other components in your Joblet using data flows or triggers.
Add a tJobletTriggerOutput component to your Joblet C design and link it to other components in your Joblet using data flows or triggers.
Drag your Joblet C from the Repository tree view to the Designer workspace between subjob A and subjob B.
Link your Joblet C to subjob A using an OnComponentOk trigger from the last component of subjob A to the tJobletTriggerInput component of your Joblet C.
Link your Joblet C to subjob B using an OnComponentOk trigger from the tJobletTriggerOutput component of your Joblet C to the Start component of subjob B.
Unlock All Questions for Talend Data-Integration-Developer Exam
Full Exam Access, Actual Exam Questions, Validated Answers, Anytime Anywhere, No Download Limits, No Practice Limits
Get All 55 Questions & Answers