Trusted Worldwide Questions & Answers
Most Recent VMware 3V0-41.22 Exam Dumps
Prepare for the VMware Advanced Deploy VMware NSX-T Data Center 3.x exam with our extensive collection of questions and answers. These practice Q&A are updated according to the latest syllabus, providing you with the tools needed to review and test your knowledge.
QA4Exam focus on the latest syllabus and exam objectives, our practice Q&A are designed to help you identify key topics and solidify your understanding. By focusing on the core curriculum, These Questions & Answers helps you cover all the essential topics, ensuring you're well-prepared for every section of the exam. Each question comes with a detailed explanation, offering valuable insights and helping you to learn from your mistakes. Whether you're looking to assess your progress or dive deeper into complex topics, our updated Q&A will provide the support you need to confidently approach the VMware 3V0-41.22 exam and achieve success.
The questions for 3V0-41.22 were last updated on Mar 30, 2025.
- Viewing page 1 out of 3 pages.
- Viewing questions 1-5 out of 16 questions
SIMULATION
Task 1
You are asked to prepare a VMware NSX-T Data Center ESXi compute cluster Infrastructure. You will prepare two ESXi servers in a cluster for NSX-T overlay and VLAN use.
All configuration should be done using the NSX UI.
* NOTE: The configuration details in this task may not be presented to you in the order in which you must complete them.
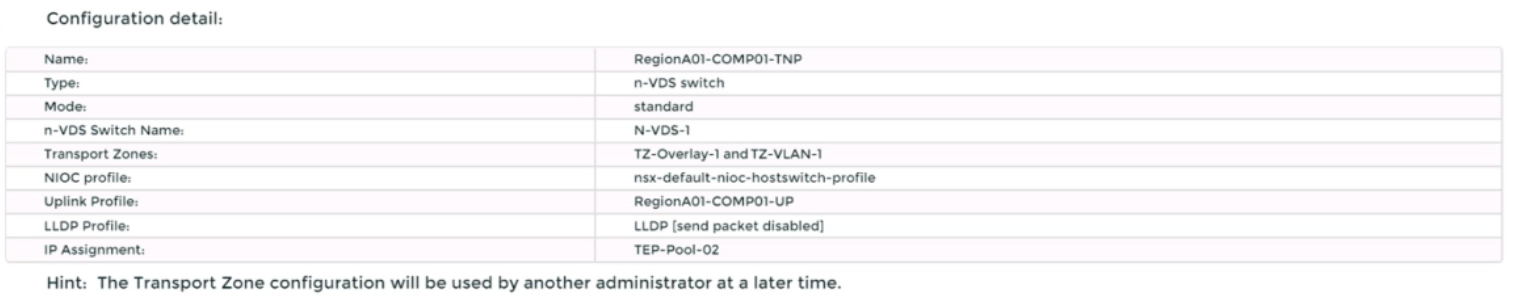
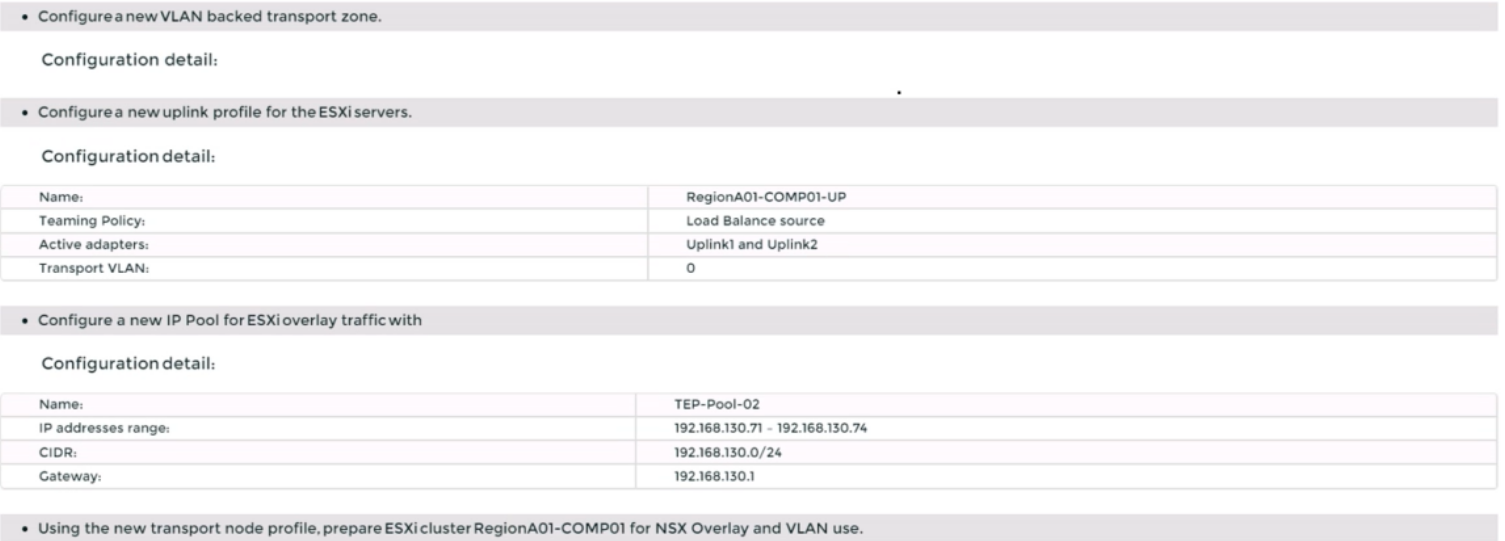
* Configure a new Transport Node profile and add one n-VDS switch. Ensure Uplink 1 and Uplink 2 of your configuration use vmnic2 and vmnic3 on the host.
Complete the requested task.
NOTE: Passwords are contained in the user_readme.txt. Configuration details may not be provided in the correct sequential order. Steps to complete this task must be completed in the proper order. Other tasks are dependent on the completion Of this task. You may want to move to other tasks/steps while waiting for configuration changes to be applied. This task should take approximately 20 minutes to complete.
To prepare a VMware NSX-T Data Center ESXi compute cluster infrastructure, you need to follow these steps:
Log in to the NSX Manager UI with admin credentials. The default URL is https://<nsx-manager-ip-address>.
Navigate to System > Fabric > Profiles > Transport Node Profiles and click Add Profile.
Enter a name and an optional description for the transport node profile.
In the Host Switches section, click Set and select N-VDS as the host switch type.
Enter a name for the N-VDS switch and select the mode as Standard or Enhanced Datapath, depending on your requirements.
Select the transport zones that you want to associate with the N-VDS switch. You can select one overlay transport zone and one or more VLAN transport zones.
Select an uplink profile from the drop-down menu or create a custom one by clicking New Uplink Profile.
In the IP Assignment section, select Use IP Pool and choose an existing IP pool from the drop-down menu or create a new one by clicking New IP Pool.
In the Physical NICs section, map the uplinks to the physical NICs on the host. For example, map Uplink 1 to vmnic2 and Uplink 2 to vmnic3.
Click Apply and then click Save to create the transport node profile.
Navigate to System > Fabric > Nodes > Host Transport Nodes and click Add Host Transport Node.
Select vCenter Server as the compute manager and select the cluster that contains the two ESXi servers that you want to prepare for NSX-T overlay and VLAN use.
Select the transport node profile that you created in the previous steps and click Next.
Review the configuration summary and click Finish to start the preparation process.
SIMULATION
Task 7
you are asked to create a custom QoS profile to prioritize the traffic on the phoenix-VLAN segment and limit the rate of ingress traffic.
You need to:
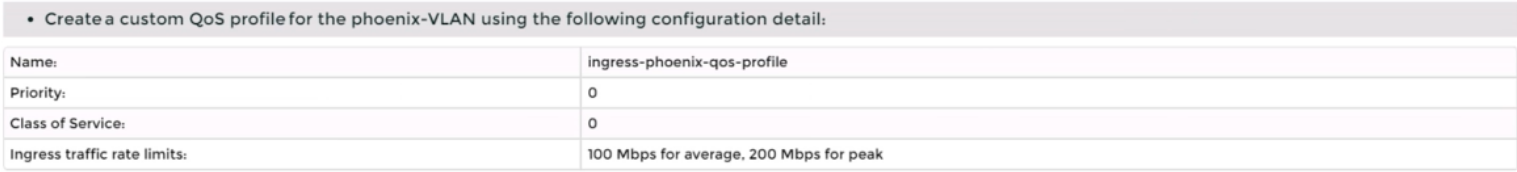
* Create a custom QoS profile for the phoenix-VLAN using the following configuration detail:
* Apply the profile on the 'phoenix-VLAN' segment
Complete the requested task.
Notes: Passwords are contained in the user_readme.txt.
take approximately 5 minutes to complete.
Subsequent tasks may require the completion of this task. This task should
To create a custom QoS profile to prioritize the traffic on the phoenix-VLAN segment and limit the rate of ingress traffic, you need to follow these steps:
Log in to the NSX Manager UI with admin credentials. The default URL is https://<nsx-manager-ip-address>.
Navigate to Networking > Segments > Switching Profiles and click Add Switching Profile. Select QoS as the profile type.
Enter a name and an optional description for the QoS profile, such as phoenix-QoS.
In the Mode section, select Untrusted as the mode from the drop-down menu. This will allow you to set a custom DSCP value for the outbound IP header of the traffic on the segment.
In the Priority section, enter 46 as the DSCP value. This will mark the traffic with Expedited Forwarding (EF) per-hop behavior, which is typically used for high-priority applications such as voice or video.
In the Class of Service section, enter 5 as the CoS value. This will map the DSCP value to a CoS value that can be used by VLAN-based logical ports or physical switches to prioritize the traffic.
In the Ingress section, enter 1000000 as the Average Bandwidth in Kbps. This will limit the rate of inbound traffic from the VMs to the logical network to 1 Mbps.
Optionally, you can also configure Peak Bandwidth and Burst Size settings for the ingress traffic, which will allow some burst traffic above the average bandwidth limit for a short duration.
Click Save to create the QoS profile.
Navigate to Networking > Segments and select the phoenix-VLAN segment that you want to apply the QoS profile to.
Click Actions > Apply Profile and select phoenix-QoS as the switching profile that you want to apply to the segment.
Click Apply to apply the profile to the segment.
You have successfully created a custom QoS profile and applied it to the phoenix-VLAN segment.
SIMULATION
Task 15
You have been asked to enable logging so that the global operations team can view inv Realize Log Insight that their Service Level Agreements are being met for all network traffic that is going in and out of the NSX environment. This NSX environment is an Active / Active two Data Center design utilizing N-VDS with BCP. You need to ensure successful logging for the production NSX-T environment.
You need to:
Verify via putty with SSH that the administrator can connect to all NSX-Transport Nodes. You will use the credentials identified in Putty (admin).
Verify that there is no current active logging enabled by reviewing that directory is empty -/var/log/syslog-
Enable NSX Manager Cluster logging
Select multiple configuration choices that could be appropriate success criteria
Enable NSX Edge Node logging
Validate logs are generated on each selected appliance by reviewing the "/var/log/syslog''
Complete the requested task.
Notes: Passwords are contained in the user _ readme.txt. complete.
These task steps are dependent on one another. This task should take approximately 10 minutes to complete.
To enable logging for the production NSX-T environment, you need to follow these steps:
Verify via putty with SSH that the administrator can connect to all NSX-Transport Nodes. You can use the credentials identified in Putty (admin) to log in to each transport node. For example, you can use the following command to connect to the sfo01w01en01 edge transport node: ssh admin@sfo01w01en01. You should see a welcome message and a prompt to enter commands.
Verify that there is no current active logging enabled by reviewing that directory is empty -/var/log/syslog-. You can use the ls command to list the files in the /var/log/syslog directory. For example, you can use the following command to check the sfo01w01en01 edge transport node: ls /var/log/syslog. You should see an empty output if there is no active logging enabled.
Navigate to System > Fabric > Profiles > Node Profiles then select All NSX Nodes then under Syslog Servers click +ADD
Enter the IP or FQDN of the syslog server, the Port and Protocol and the desired Log Level then click ADD
Select multiple configuration choices that could be appropriate success criteri
a. You can use the search_web('NSX-T logging success criteria') tool to find some information on how to verify and troubleshoot logging for NSX-T. Some of the possible success criteria are:
The syslog server receives log messages from all NSX nodes
The log messages contain relevant information such as timestamp, hostname, facility, severity, message ID, and message content
The log messages are formatted and filtered according to the configured settings
The log messages are encrypted and authenticated if using secure protocols such as TLS or LI-TLS
Run the following command to configure a log server and the types of messages to send to the log server. Multiple facilities or message IDs can be specified as a comma delimited list, without spaces.
set logging-server <hostname-or-ip-address [:port]> proto
Validate logs are generated on each selected appliance by reviewing the '/var/log/syslog''. You can use the cat or tail commands to view the contents of the /var/log/syslog file on each appliance. For example, you can use the following command to view the last 10 lines of the sfo01w01en01 edge transport node: tail -n 10 /var/log/syslog. You should see log messages similar to this:
2023-04-06T12:34:56+00:00 sfo01w01en01 user.info nsx-edge[1234]: 2023-04-06T12:34:56Z nsx-edge[1234]: INFO: [nsx@6876 comp='nsx-edge' subcomp='nsx-edge' level='INFO' security='False'] Message from nsx-edge
You have successfully enabled logging for the production NSX-T environment.
SIMULATION
Task 5
You are asked to configure a micro-segmentation policy for a new 3-tier web application that will be deployed to the production environment.
You need to:
Notes:
Passwords are contained in the user_readme.txt. Do not wait for configuration changes to be applied in this task as processing may take some time. The task steps are not dependent on one another. Subsequent tasks may require completion of this task. This task should take approximately 25 minutes to complete.
Step-by-Step Guide
Creating Tags and Security Groups
First, log into the NSX-T Manager GUI and navigate to Inventory > Tags to create tags like 'BOSTON-Web' for web servers and assign virtual machines such as BOSTON-web-01a and BOSTON-web-02
a. Repeat for 'BOSTON-App' and 'BOSTON-DB' with their respective VMs. Then, under Security > Groups, create security groups (e.g., 'BOSTON Web-Servers') based on these tags to organize the network logically.
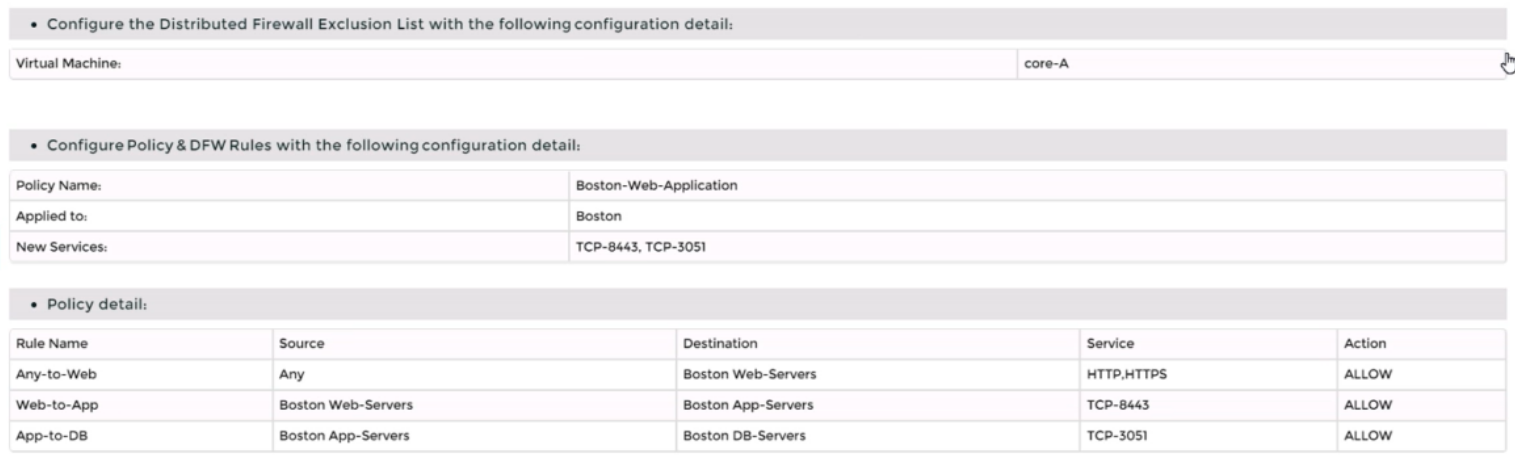
Excluding Virtual Machines
Next, go to Security > Distributed Firewall > Exclusion List and add the 'core-A' virtual machine to exclude it from firewall rules, ensuring it operates without distributed firewall restrictions.
Defining Custom Services
Check Security > Services for existing services. If 'TCP-9443' and 'TCP-3051' are missing, create them by adding new services with the protocol TCP and respective port numbers to handle specific application traffic.
Setting Up the Policy and Rules
Create a new policy named 'BOSTON-Web-Application' under Security > Distributed Firewall > Policies. Add rules within this policy:
Allow any source to 'BOSTON Web-Servers' for HTTP/HTTPS.
Permit 'BOSTON Web-Servers' to 'BOSTON App-Servers' on TCP-9443.
Allow 'BOSTON App-Servers' to 'BOSTON DB-Servers' on TCP-3051. Finally, save and publish the policy to apply the changes.
This setup ensures secure, segmented traffic for the 3-tier web application, an unexpected detail being the need to manually create custom services for specific ports, enhancing flexibility.
Survey Note: Detailed Configuration of Micro-Segmentation Policy in VMware NSX-T Data Center 3.x
This note provides a comprehensive guide for configuring a micro-segmentation policy for a 3-tier web application in VMware NSX-T Data Center 3.x, based on the task requirements. The process involves creating tags, security groups, excluding specific virtual machines, defining custom services, and setting up distributed firewall policies. The following sections detail each step, ensuring a thorough understanding for network administrators and security professionals.
Background and Context
Micro-segmentation in VMware NSX-T Data Center is a network security technique that logically divides the data center into distinct security segments, down to the individual workload level, using network virtualization technology. This is particularly crucial for a 3-tier web application, comprising web, application, and database layers, to control traffic and enhance security. The task specifies configuring this for a production environment, with notes indicating passwords are in user_readme.txt and no need to wait for configuration changes, as processing may take time.
Step-by-Step Configuration Process
Step 1: Creating Tags
Tags are used in NSX-T to categorize virtual machines, which can then be grouped for policy application. The process begins by logging into the NSX-T Manager GUI, accessible via a web browser with admin privileges. Navigate to Inventory > Tags, and click 'Add Tag' to create the following:
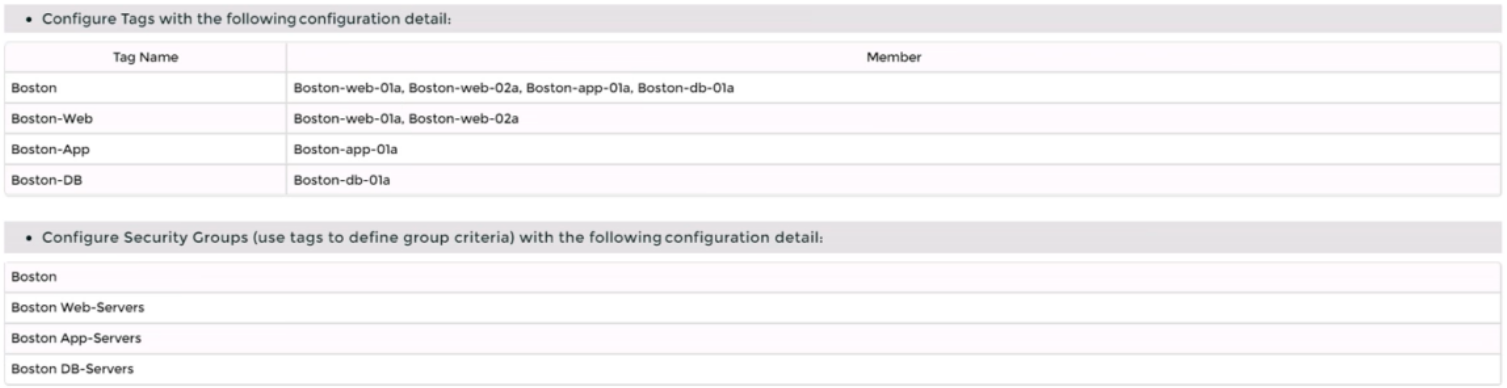
Tag name: 'BOSTON-Web', assigned to virtual machines BOSTON-web-01a and BOSTON-web-02a.
Tag name: 'BOSTON-App', assigned to BOSTON-app-01a.
Tag name: 'BOSTON-DB', assigned to BOSTON-db-01a.
This step ensures each tier of the application is tagged for easy identification and grouping, aligning with the attachment's configuration details.
Step 2: Creating Security Groups
Security groups in NSX-T are logical constructs that define membership based on criteria like tags, enabling targeted policy application. Under Security > Groups, click 'Add Group' to create:
Group name: 'BOSTON Web-Servers', with criteria set to include the 'BOSTON-Web' tag.
Group name: 'BOSTON App-Servers', with criteria set to include the 'BOSTON-App' tag.
Group name: 'BOSTON DB-Servers', with criteria set to include the 'BOSTON-DB' tag.
This step organizes the network into manageable segments, facilitating the application of firewall rules to specific tiers.
Step 3: Excluding 'core-A' VM from Distributed Firewall
The distributed firewall (DFW) in NSX-T monitors east-west traffic between virtual machines. However, certain VMs, like load balancers or firewalls, may need exclusion to operate without DFW restrictions. Navigate to Security > Distributed Firewall > Exclusion List, click 'Add', select 'Virtual Machine', and choose 'core-A'. Click 'Save' to exclude it, ensuring it bypasses DFW rules, as per the task's requirement.
Step 4: Defining Custom Services
Firewall rules often require specific services, which may not be predefined. Under Security > Services, check for existing services 'TCP-9443' and 'TCP-3051'. If absent, create them:
Click 'Add Service', name it 'TCP-9443', set protocol to TCP, and port to 9443.
Repeat for 'TCP-3051', with protocol TCP and port 3051.
This step is crucial for handling application-specific traffic, such as the TCP ports mentioned in the policy type (TCP-9443, TCP-3051), ensuring the rules can reference these services.
Step 5: Creating the Policy and Rules
The final step involves creating a distributed firewall policy to enforce micro-segmentation. Navigate to Security > Distributed Firewall > Policies, click 'Add Policy', and name it 'BOSTON-Web-Application'. Add a section, then create the following rules:
Rule Name: 'Any-to-Web'
Source: Any (select 'Any' or IP Address 0.0.0.0/0)
Destination: 'BOSTON Web-Servers' (select the group)
Service: HTTP/HTTPS (predefined service)
Action: Allow
Rule Name: 'Web-to-App'
Source: 'BOSTON Web-Servers'
Destination: 'BOSTON App-Servers'
Service: TCP-9443 (custom service created earlier)
Action: Allow
Rule Name: 'App-to-DB'
Source: 'BOSTON App-Servers'
Destination: 'BOSTON DB-Servers'
Service: TCP-3051 (custom service created earlier)
Action: Allow
After defining the rules, click 'Save' and 'Publish' to apply the policy. This ensures traffic flows as required: any to web servers for HTTP/HTTPS, web to app on TCP-9443, and app to database on TCP-3051, while maintaining security through segmentation.
Additional Considerations
The task notes indicate no need to wait for configuration changes, as processing may take time, and steps are not dependent, suggesting immediate progression is acceptable. Passwords are in user_readme.txt, implying the user has necessary credentials. The policy order is critical, with rules processed top-to-bottom, and the attachment's 'Type: TCP-9443, TCP-3051' likely describes the services used, not affecting the configuration steps directly.
Table: Summary of Configuration Details
Component
Details
Tags
BOSTON-Web (BOSTON-web-01a, BOSTON-web-02a), BOSTON-App (BOSTON-app-01a), BOSTON-DB (BOSTON-db-01a)
Security Groups
BOSTON Web-Servers (tag BOSTON-Web), BOSTON App-Servers (tag BOSTON-App), BOSTON DB-Servers (tag BOSTON-DB)
DFW Exclusion List
Virtual Machine: core-A
Custom Services
TCP-9443 (TCP, port 9443), TCP-3051 (TCP, port 3051)
Policy Name
BOSTON-Web-Application
Firewall Rules
Any-to-Web (Any to Web-Servers, HTTP/HTTPS, Allow), Web-to-App (Web to App-Servers, TCP-9443, Allow), App-to-DB (App to DB-Servers, TCP-3051, Allow)
This table summarizes the configuration, aiding in verification and documentation.
Unexpected Detail
An unexpected aspect is the need to manually create custom services for TCP-9443 and TCP-3051, which may not be predefined, highlighting the flexibility of NSX-T for application-specific security policies.
Conclusion
This detailed process ensures a robust micro-segmentation policy, securing the 3-tier web application by controlling traffic between tiers and excluding specific VMs from DFW, aligning with best practices for network security in VMware NSX-T Data Center 3.x.
SIMULATION
Task 14
An administrator has seen an abundance of alarms regarding high CPU usage on the NSX Managers. The administrator has successfully cleared these alarms numerous times in the past and is aware of the issue. The administrator feels that the number of alarms being produced for these events is overwhelming the log files.
You need to:
* Review CPU Sensitivity and Threshold values.
Complete the requested task.
Notes: Passwords are contained in the user_readme.txt. This task is not dependent on other tasks. This task should take approximately 5 minutes to complete.
To review CPU sensitivity and threshold values, you need to follow these steps:
Log in to the NSX Manager UI with admin credentials. The default URL is https://<nsx-manager-ip-address>.
Navigate to System > Settings > System Settings > CPU and Memory Thresholds.
You will see the current values for CPU and memory thresholds for NSX Manager, NSX Controller, and NSX Edge. These values determine the percentage of CPU and memory usage that will trigger an alarm on the NSX Manager UI.
You can modify the default threshold values by clicking Edit and entering new values in the text boxes. For example, you can increase the CPU threshold for NSX Manager from 80% to 90% to reduce the number of alarms for high CPU usage. Click Save to apply the changes.
Unlock All Questions for VMware 3V0-41.22 Exam
Full Exam Access, Actual Exam Questions, Validated Answers, Anytime Anywhere, No Download Limits, No Practice Limits
Get All 16 Questions & Answers